In this whitepaper we are going to investigate how to find and deal with stress concentrations, review mesh control and how it affects stress results.
For beginners: before starting this practice, it is recommended to read the previous whitepapers, first.
Problem Description
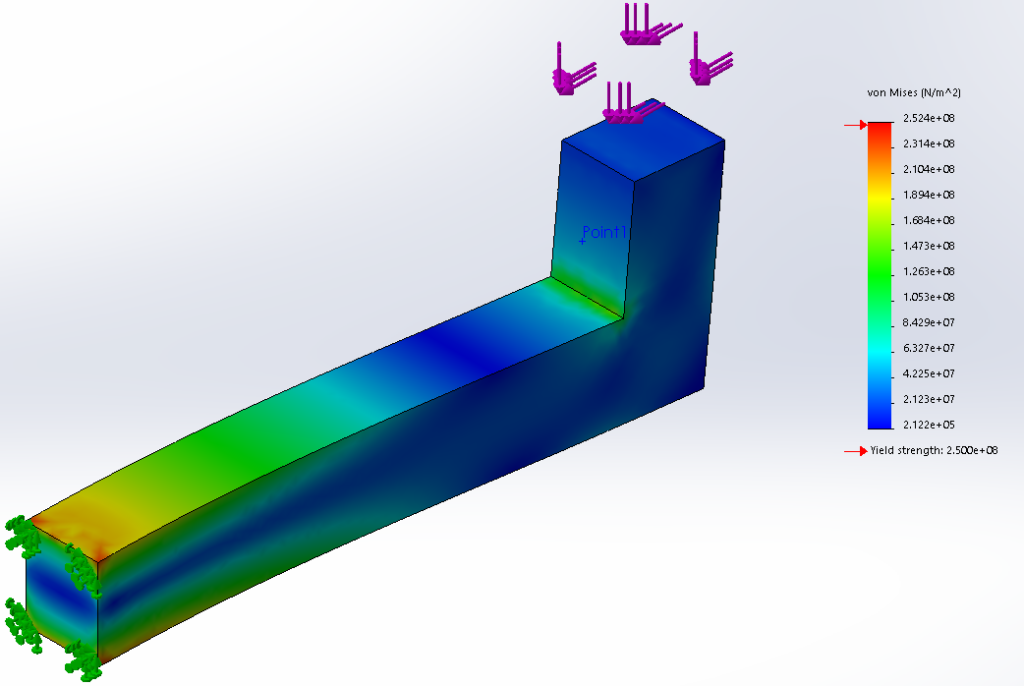
During this study we analyse a rail support- simplified assembly is presented in figure (1)- under normal and horizontal load of F=2.7kN. Support is laser cut from 16mm plate, material is AS3678-250.

As mentioned in the introductory of this study we are focusing on stress concentration, to achieve this goal a reference point at middle of bend line (Point 1) is defined, figure (2).

To obtain stress value of point 1 at each study, we define a sensor for this point, right click on the Sensors folder in the model tree and select “Add Sensor…”, figure (3).

On the Sensor Type section “Simulation Data“, on Data Quality select “Workflow Sensitive“, for “Properties” select Point1, figure (4).

Finite Element Analysis
Create Study
Create a static study and name it “Stress Concentration“, figure (5).

Apply Material
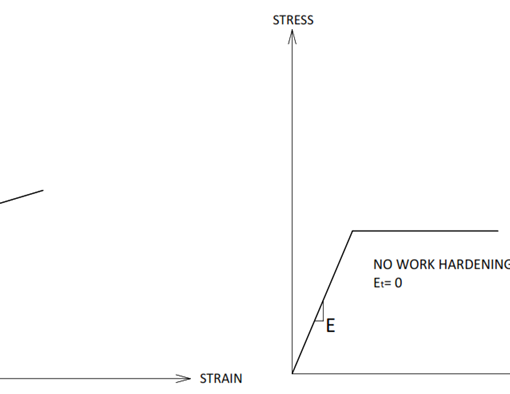
First create a custom material named AS3678-250 with properties shown in figure (6), then assign it to the model.

If you don’t know how to create custom material, follow steps in this link.
Set the Connections
Not applicable for sole part.
Apply Fixtures
Apply fixed fixture to the end of the support, figure (7).

Define The Loads
Add 2700N normal and horizontal to the end of support, figure (8).

Mesh the Model
Apply mesh to the model, Curvature-based Mesh with the default size of 3.7mm, figure (9).

Run the Analysis
FEA results of Von Mises stress for the analysis is presented in figure (10).

To get the exact amount of stress, use probe tool, on options select from sensors, stress in Point1 is 119.8MPa, figure (11).

Evaluate the Results
To have confidence in FEA results, check the stress Error plot, figure (12).

Due to high percentage error in the stress concentrated areas, we use mesh control to reduce the mesh element size in that area and check again the stress results.
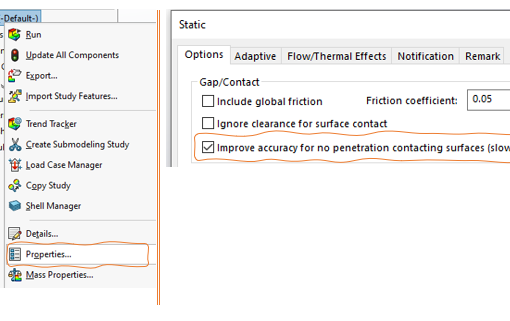
To have a record of what has been done, copy this study, to do that, right click on the study name and select “Copy Study”, figure (13).

Select a name for the study as you like, something like “Mesh Control 01”. In the new study apply mesh control to the edge with the default numbers, figure (14). Then run the analysis and see the stress in Point1.

The stress in point1 is 159MPa, about 33% increase in the stress. During each study if you see such a big stress difference by changing mesh size, you normally refine the mesh in that area more to see how stress changes in that area.
To do that, copy the study again, names it “Mesh Control 02”, modify the mesh control and slide the mesh density bar to right (fine side), run the analysis and check the stress in Point1, the stress in Point1 is 213.4MPa (34% increase). Meanwhile, if you check the stress Error plot you would see that the error percentage in the high stress area is reducing!
Based on elasticity stress in sharp corners, stress is division of load on a point (no area) so that it is infinite. But the software couldn’t generate infinite stress due to discretization error.
To obtain correct amount of stress in this area just add a small fillet there, for example add 1mm fillet to the line and repeat this three studies again. Comparison between stress value in these six studies are presented in chart (1) and the trend is displayed in chart (2).


As it could be understood from chart (2), the stress value is converging to a constant value, the mesh control size 01 is accurate enough and the obtained result is reliable.
Notice: the stress in Point1 is not the maximum stress in that area.
What is Next:
On the next whitepaper, we will start finite element analysis of assemblies.


