In this whitepaper we are going to apply our learning in the previous session into practice; also, learn about the concept of “Make Rigid ” and how to use them to accelerate an analysis.
Problem Description
In this whitepaper we are going to carry out the analysis of handrail support presented in whitepaper six with more details. We are going to check the strength of a saddle; assume that the handrail is going to be mounted on a bridge and should be designed according to AS5100.2, section 12.5 clauses (a) to (d). According to this standard two normal and horizontal load of 0.75kN/m shall be applied on the top rail; the spacing between stanchions is 2.0m.
Disclaimer: this design is just for educational purposes and is not a barrier design.
For saddle specification and dimensions, refer to white paper six, the distance between stanchions (posts) is presented in figure (1). We are interested to find stress distribution in the middle saddle. All parts are welded together and loads are 5.4kN horizontal and vertical to the top rail, stanchions are fixed to the bridge.
![Spacing of 2.0m between stanchions [three stanchions in this figure]](https://esolidesign.com/wp-content/uploads/2021/09/image.png)
“Make Rigid” Concept
Especially for large assembly analysis when you are not interested in the stress results of other parts, rather than replacing them with fixed fixtures/ loads; you could keep them in the analysis and by converting them into rigid bodies save the solution time. This simplification will lead to unreliable results for rigid parts. Having said that, the only available result for rigid bodies is displacement.
There is another circumstance where you could use this concept. When the solid body is much more stiffer than the parts it is in contact with, for instance pressing of plastics; drawing of soft sheets. In this case, this assumption would result in fairly accurate results.
How to convert a part into Rigid body:
In the simulation study tree, in part section, right click on a part and select “Make Rigid”, figure (2).

Finite Element Analysis
Create Study
Create a static study and name it “Assembly Analysis”, figure (3).

Apply Material
Assign the custom properties as presented in white paper six, “Apply Material” section. Since we are only interested to saddle strength, you could apply this properties to all parts.
Part Simplification [Make Rigid/ Shell Part]
Make Rigid
To convert parts that we are not interested in their stress results, select them all, right click and select “Make Rigid”, figure (4).

Create Shell Part
Since we could simplify the handrail by converting to shell elements, it is not necessary to make it rigid, follow the steps in figure (5) to convert handrail from solid element into shell element.


Set the Connections
Global Contact Options
On assembly analysis by default the global contact is set as “Bonded”, normally we don’t change the global component contacts and keep the selections as they are, figure (6).

Set Bonded Contact Between Parts
To define bonded contact between parts, right click on either “Connections” or “component Contacts” and select “Contact Set…”, figure (7).

on the type section select “Bonded”, for the set1 select handrail outer surface and for Set2 select the saddle surfaces, hide parts as required, figure (8).

Repeat this step to define bonded contact between saddle and stanchions.
Apply Fixture
Add fixed fixture at the bottom of all three stanchions, figure (9).

Define The Loads
Right click on the “External Loads” and select “Force”.
Select outer surface of handrail, pick the “Selected Direction” option, choose “Right Plane” or any other plane if you like and enter loads of 5400N, tick “Reverse Direction” if required, figure (10).

Mesh the Model
Right click on the “Mesh” in the simulation tree, select “Create Mesh…”, on the mesh parameters tab select “Curvature-based mesh” and accept the predefined mesh size, figure (11).

Then right click on the “Mesh” again and select “Apply Mesh Control…”, for the selected entities from the assembly tree select the middle saddle, set the mesh parameters to 5mm, figure (12).

Run the Analysis
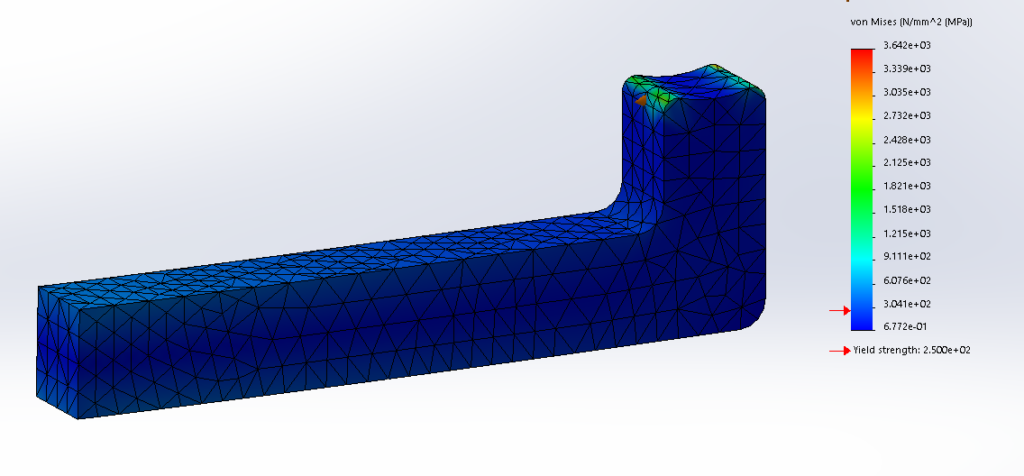
FEA results of Von Mises stress for the analysis is presented in figure (13).

To assure about the convergence of the results, copy the study, rerun the analysis with different mesh control sizes for middle saddle and check the results. Modify the mesh sizes from 5 to 3 and 1.5 then see the results.
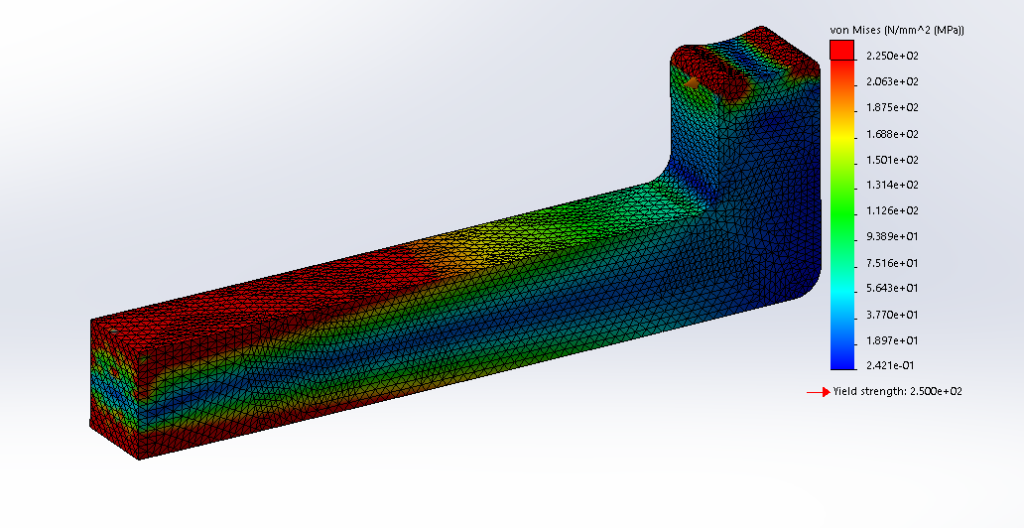
After running three analysis with different mesh sizes, you could put the cap on maximum stress shown on the desired part. In the other word, you can limit the amount of Von Mises maximum stress shown on the part (sections with stress above the set stress will be in Red [if you had not changed the result color format from the default format]) to have a better judge about how the fitting is reacting under the load.
To do this, right click on the stress1 (-vonMises-) and select “Chart Options…”; then unpick “Automatically defined maximum value” and under it enter amount of 225, figure (14).


Interpreting the results
As it could be seen in figure (15), the level of stress in the saddle is beyond the yield stress of the fitting. Could we conclude that the saddle fails? The answer to this question and understanding how to interpret the FEA results is the subject of the next whitepaper.

What is Next:
On the next whitepaper, we will discuss how to interpret the FEA results.


