In this article we complete the FEA of the problem explained in the previous whitepaper by running the model, postprocessing, reviewing and discussing the results. It is recommended to read part 1 first, in here.
6- Run the Analysis
To run the analysis, use either of the steps presented in Table (6-1).

7- Evaluate the Results
Before investigating the FEA results, let us see what we expect to see. Due to the change in geometry we expect to see stress concentration around the notch. There are academic texts about the stress concentration factor for this geometry figure (7-1).

The maximum stress would be around:
σ=Kt x F/A= 2.07×10⁴ / ((50-16)x10) = 57.6 MPa
Where:
σ= Maximum Stress (MPa),
Kt= Stress Concentration Factor,
F= Applied Load (N),
A= Cross Section Area (mm2).
Results Plot
SolidWorks Simulation, by default creates three result plots (type of these three result plots could be modified in setting, out of scope of this whitepaper.), stress1 (-vonMises-), Displacement1 (-Res disp-), strain1 (-Equivalent-), figure (7-2).

To show either of the plots shown in figure (7-2), double click on it or right click on it and select show. Double click on the Stress1 plot and see the results, figure (7-3).

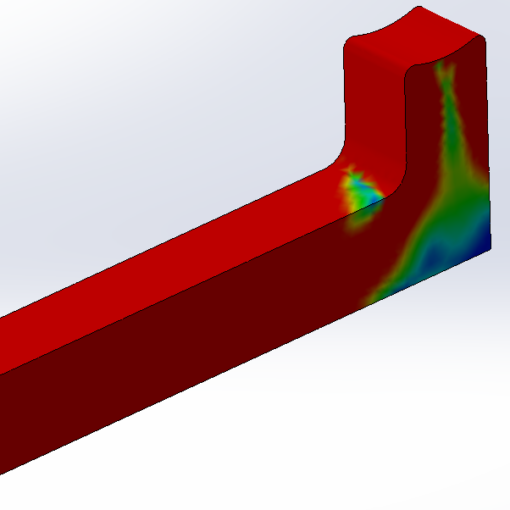
As it could be seen the maximum stress is at the bottom of notch with the value of 61.1MPa. The difference between the academic and FEA results is 5.7%. There are two methods that you can evaluate the results accuracy. First. if we have the fortunate of knowing the theoretical results the comparison between them is the best tool, as we do in here.
However, for the most cases we don’t have the option of knowing the theoretical results. There is a tool in SolidWorks Simulation that helps us to check the results accuracy. This tool is stress plot of “ERR: Energy Norm Error”.
ERR: Energy Norm Error Plot
This stress plot is a powerful tool to evaluate the mesh size in high stress areas of a model. This plot shows the error percentage in strain/ stress values in individual mesh elements. To understand this, we need to grasp the difference between couple of items, mesh node vs Gaussian point and nodal vs element values, first.
Mesh Node VS Gaussian Point
To calculate stress in an element, SolidWorks calculates displacement at all nodes first; then, it calculates strains and next stress of each element independently. The stresses are calculated at specific points in each element called Gaussian or Quadrature points, number of Gaussian points for each element type is presented in Chart (7-1).

For clarification purpose, Gaussian points and mesh nodes are shown in figure (7-4).

Figure (7-4)- Gaussian Point and Mesh Nodes
Note: figure (7-3) is for education purpose only, “Draft elements only have 1 Gauss point, Chart (7-1)”.
Nodal VS Element Values
Most of the time a mesh node is shared between several elements and each element has different strain/ stress value. If values of all elements around a node averaged to obtain a single value at the shared node, it called Nodal value.
Alternatively, if the stress/ strain values of each elements is average of Gaussian points values inside that element, it called element values.
For better understanding, have a look at the Table (7-1). Also, to see the difference between graphical plots of Nodal and element values, see figures (7-5 & 7-6).


Now, we have enough tools to describe ERR plot. Energy Norm Error plot shows the percent error between node and element values. By aid of this plot, you could highlight the areas that need more attention, and you could use the mesh control tool to refine the mesh element size in that areas, instead of refining global mesh size of the model.
How to get EER Plot:
To get any type of stress plot (including ERR plot), follow these steps:
1- Right click on Results, select Define Stress Plot…

2- From the available list of stress plots (drop down list, in Display Section), select ERR: Energy Norm Error

3- Then click on the OK tick mark.
The ERR plot for this study, is presented in figure (7-7).

As expected and could be seen there is some level of inaccuracy of the stress results around the slots.
To increase the result accuracy, we could either decrease the global mesh size or use mesh control; in this study, mesh control technique was used.
How to do Mesh Control
To apply mesh control on the model, follow these steps:
1- Right click on Mesh in Study Folder and select Apply Mesh Control…:

2- On the Selected Entities section, select these two faces and use these mesh parameters:
Element Size: 0.5mm, Ratio: 1.5

3- Then click on OK tick mark.
Then re-run the analysis, the stress plot after re-run is presented in figure (7-8).

Figure (7-8)- Stress Plot of part after applying mesh control
Check the stress error plot which is presented in figure (7-9), as it could be understood the stress result is very accurate. To get the maximum amount of error on the notch surface we could use a tool, named probe.

To get access to this tool, follow these steps:
- Click on the drop-down triangle, next to Plot Tools,
- Then click on the Probe, figure (7-10).

On the Options section, click on the “On selected entities”; then, click on the notch surface; next click on the update. On the Summary section, check the maximum, figure (7-11).

While there is no change in the stress results (61.1MPa increased to 61.2MPa), but as it could be seen in the figure (7-9) the results of the analysis is more accurate.
Results Discussion
It should be noted that while there is discrepancy between academic and FEA results, but the academic calculations are valid for thin plates where a plane stress condition is acceptable. SolidWorks Simulation checks the stress for a plate that the plane stress condition is not valid (Thick Plate). (As an exercise you could reduce the thickness of part to 4mm and compare the academic and FEA results). In this case we could include that the FEA results are more accurate than academic calculations.
To see how mesh control reduces the required resources and calculation time to complete a finite element analysis; meanwhile, increases the results accuracy table (7-2) presented.
In this table five different mesh types are investigated. From top to bottom, coarse mesh (CM) (on the mesh tab, mesh density section, mesh factor slides to the left), coarse mesh with mesh control (CM&MC) (mesh control parameters same as listed above), default mesh (DM), default mesh with mesh control (DM&MC) and refine mesh (RM) (on the mesh tab, mesh density section, mesh factor slides to the right).
| Mesh Type | Max. Disp. mm | Max. Stress (Von. Mis.) MPa | Number of Nodes | Number of Elements | Number of DOF | Running Time (s) |
| CM | 1.07E-2 | 55.7 | 2881 | 1585 | 8442 | 0 |
| CM&MC | 1.07E-2 | 61.2 | 72100 | 47122 | 216099 | 6 |
| DM | 1.07E-2 | 61.0 | 17814 | 11291 | 52755 | 2 |
| DM&MC | 1.07E-2 | 61.2 | 54974 | 34223 | 164313 | 4 |
| RM | 1.07E-2 | 61.1 | 121730 | 83307 | 362691 | 10 |
Note: Depending on your software package, your numbers might be different.
What is Next:
On the next whitepaper, we will explore about “Stress Concentration” in CAD models and how to deal with them.


